What is a Bitcoin drawdown?
A drawdown is the percentage a price has fallen below an earlier peak. Here we compare each daily USD reference with the highest daily reference observed up to that date in our snapshot. A move from $100 to $50 is a 50% drawdown; returning from $50 to $100 requires a 100% rise.
Historical declines, measured consistently
Data as of 2026-10-25 · USD daily references. Snapshot fetched . Coverage begins 2010-08-18; 5,913 positive observations. This is a maintained static snapshot, not a live quote.
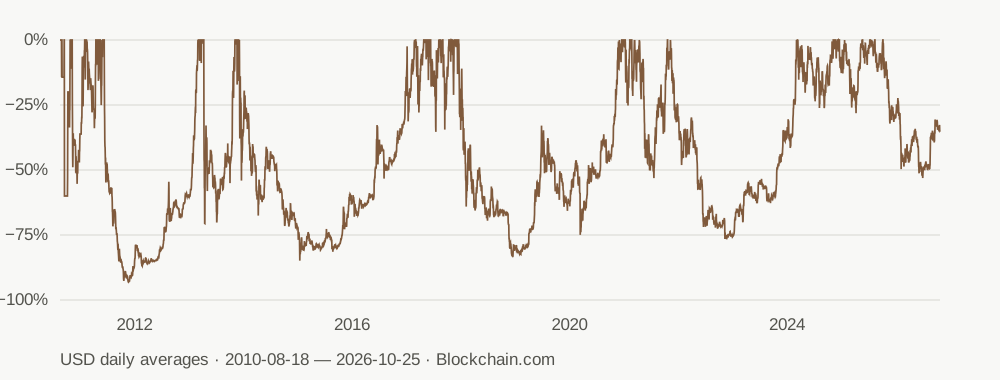
Ten deepest separate drawdown episodes in this snapshot
| Peak date · UTC | Trough date · UTC | Decline | Days to trough | First observed recovery · UTC | Days from peak to recovery |
|---|---|---|---|---|---|
| 2011-06-11 | 2011-11-22 | -93.20% | 164 | 2013-03-02 | 630 |
| 2013-12-05 | 2015-01-15 | -84.87% | 406 | 2017-02-24 | 1177 |
| 2017-12-17 | 2018-12-16 | -83.24% | 364 | 2020-12-01 | 1080 |
| 2021-11-09 | 2022-11-22 | -76.67% | 378 | 2024-03-05 | 847 |
| 2013-04-10 | 2013-04-17 | -70.57% | 7 | 2013-11-06 | 210 |
| 2010-09-16 | 2010-09-17 | -60.00% | 1 | 2010-10-25 | 39 |
| 2010-11-08 | 2010-12-11 | -55.32% | 33 | 2011-01-31 | 84 |
| 2021-04-14 | 2021-07-21 | -53.13% | 98 | 2021-10-20 | 189 |
| 2025-10-07 | 2026-07-01 | -53.09% | 267 | Not observed by 2026-10-25 | Ongoing |
| 2017-06-12 | 2017-07-17 | -35.33% | 35 | 2017-08-06 | 55 |
Download all daily calculations (CSV) · Download all separate episodes (CSV) · Download the underlying snapshot (JSON) · Download the labeled chart (SVG).
For a citation, identify BuyBitcoinsToday’s derived calculations, Blockchain.com as the underlying price source, the observation range, snapshot fetch time and methodology. We do not claim ownership of the underlying price observations or grant a license to third-party data.
How far below the earlier high was a selected date?
Choose a date to inspect the daily reference and its earlier high.
Does recovery mean an investor broke even?
No. Recovery here only means the daily USD reference met or exceeded the earlier peak reference. Fees, taxes, inflation, exchange access, custody losses and actual execution prices are excluded. A person’s purchase may have happened at a different price or time.
Why can another source show a different drawdown?
This series uses daily averages across exchanges, not intraday highs or lows on one exchange. Different venues, currencies, time zones and sampling methods can change the peak, trough and recovery date. The earliest positive observation is the starting boundary; it is not Bitcoin’s first trade. An ongoing episode is incomplete and can deepen or continue after the snapshot ends.
How are these calculations produced?
For each observed date: drawdown = (daily reference ÷ running peak − 1) × 100. An episode begins when the reference falls below its running peak and ends on the first later observation at or above that peak. The lowest observation before recovery is the trough. Equal highs use the most recent peak date. Calendar-day durations use UTC dates, not trading-session counts. Missing observations are not filled, so the first observed recovery can be later than the true recovery.
The table lists the ten deepest separate episodes, including an ongoing episode if it qualifies. Nested declines inside an unrecovered episode are not separate events. The chart includes every valid daily observation in its selected time window, with a fixed 0% to −100% vertical scale. Data is in USD; it is a dated snapshot, not a live all-time-high tracker. See the full data method.
Explore both sides of the result
Compare annual reference changes, inspect a single historical purchase, or read Bitcoin’s main risks. A return calculator cannot capture every path taken between two dates.